The Krystal Solutions Reports and Dashboards Implementation packages are designed for clients who need to extract meaningful analytics from their Salesforce data in order to gain real insights into their business. Each package can help new or existing Salesforce customers more effectively track progress towards individual and company goals (e.g. open pipeline, won revenue), productivity (i.e. open and completed Tasks), and other crucial business metrics (e.g. average sales cycle duration, Lead conversion rates, Account demographics).
Custom Reports Bundle |
Custom Dashboard |
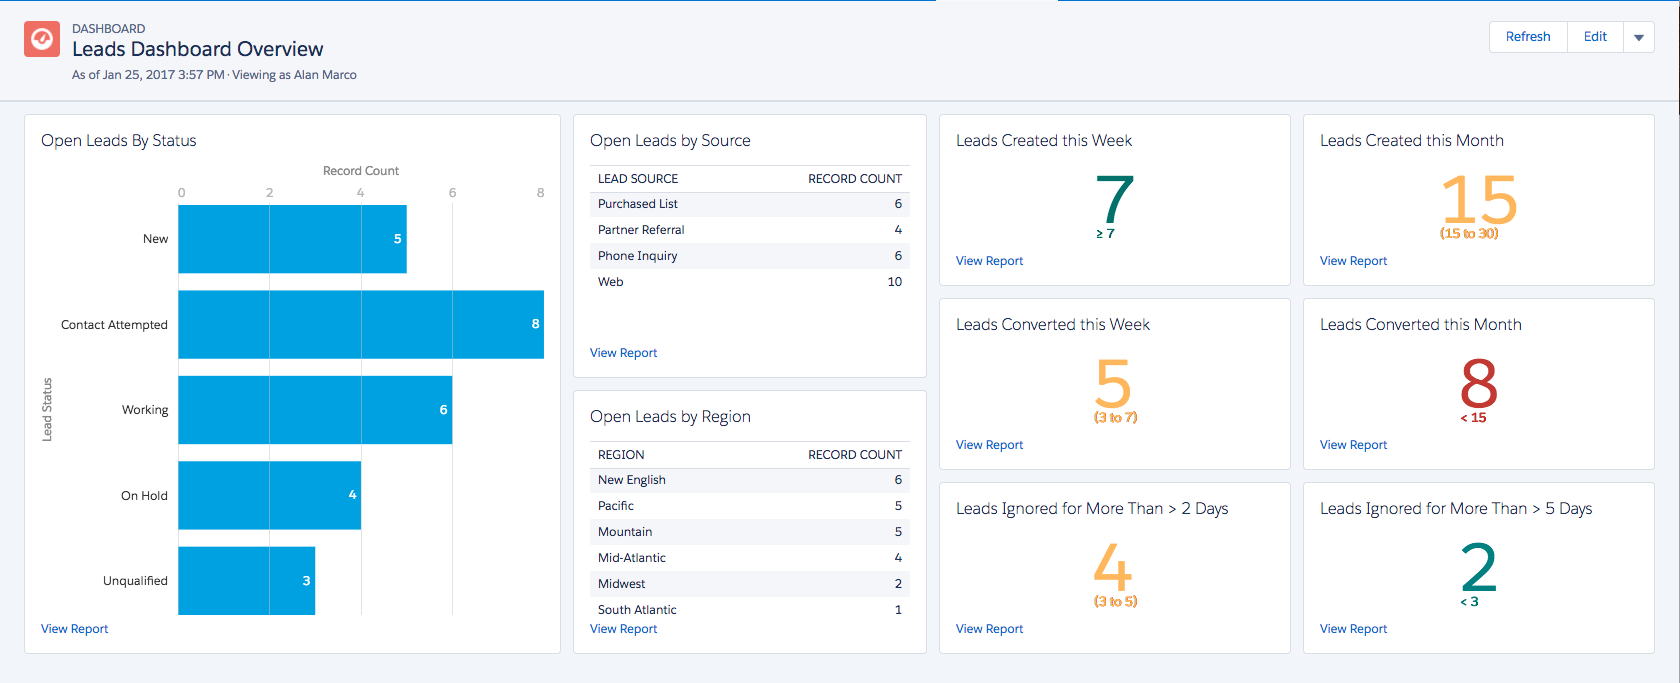
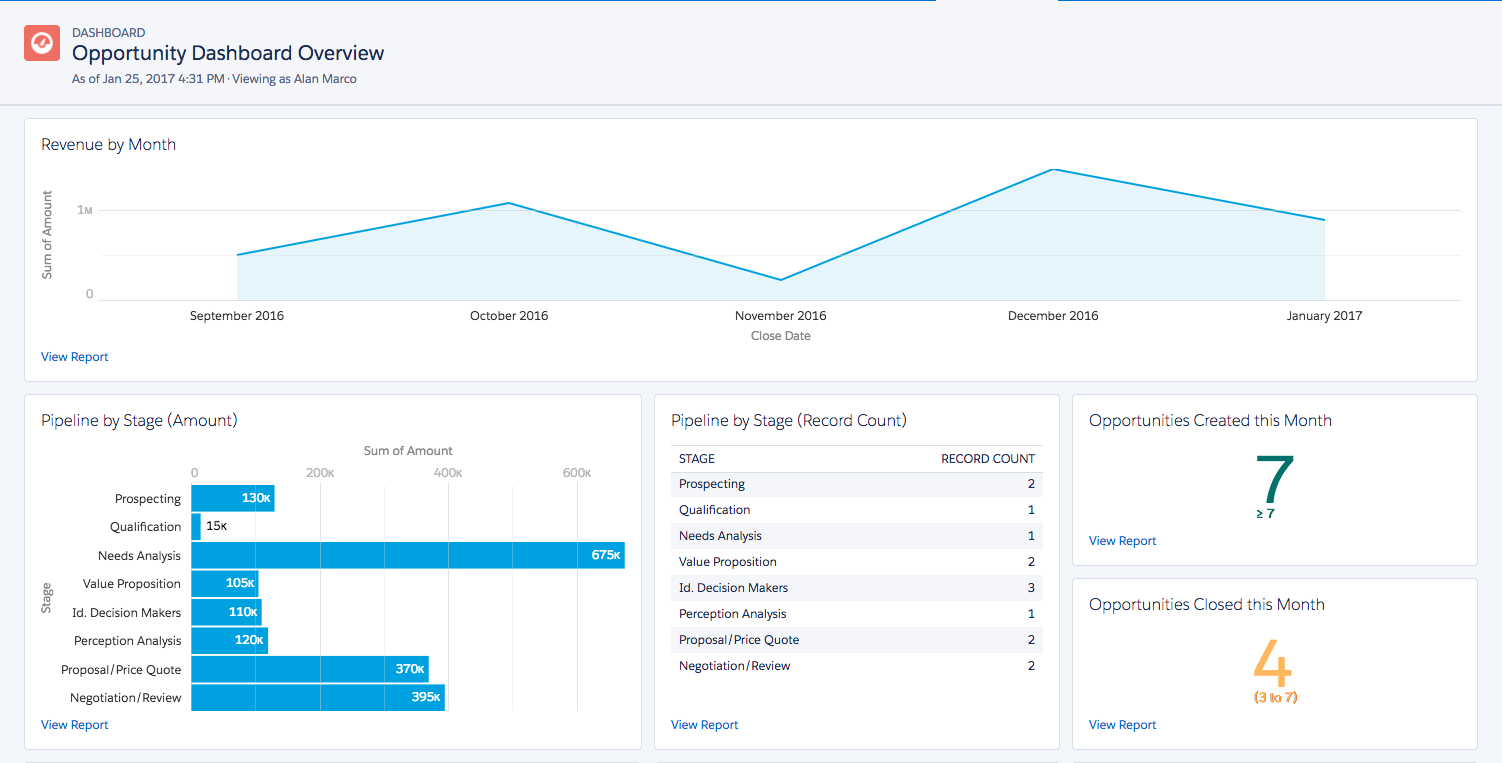
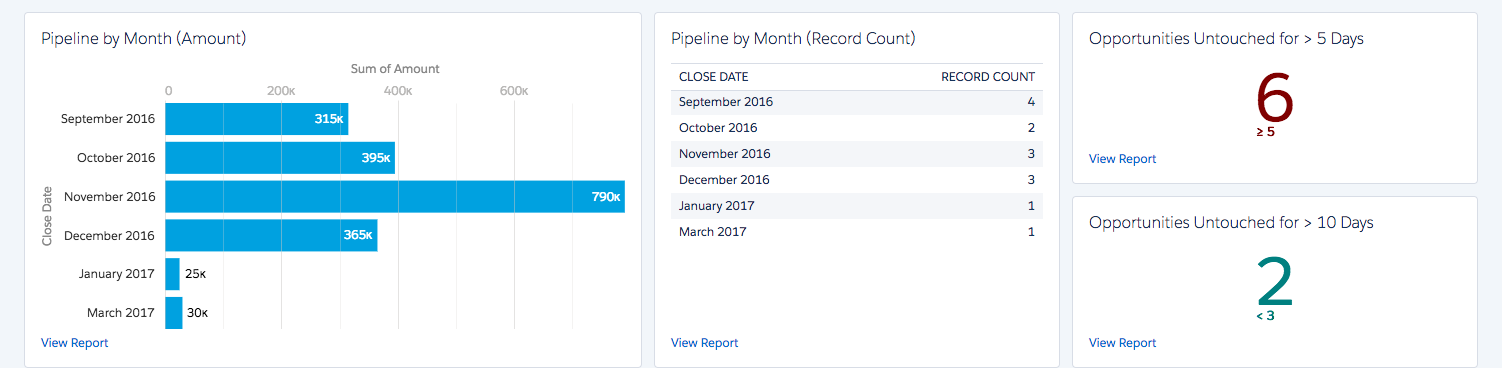
Sales Cloud Dashboards |
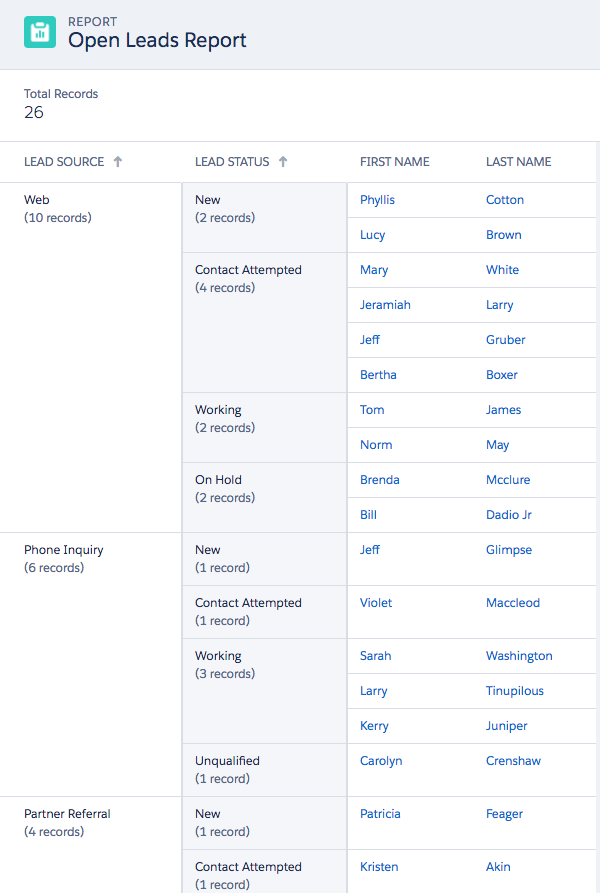
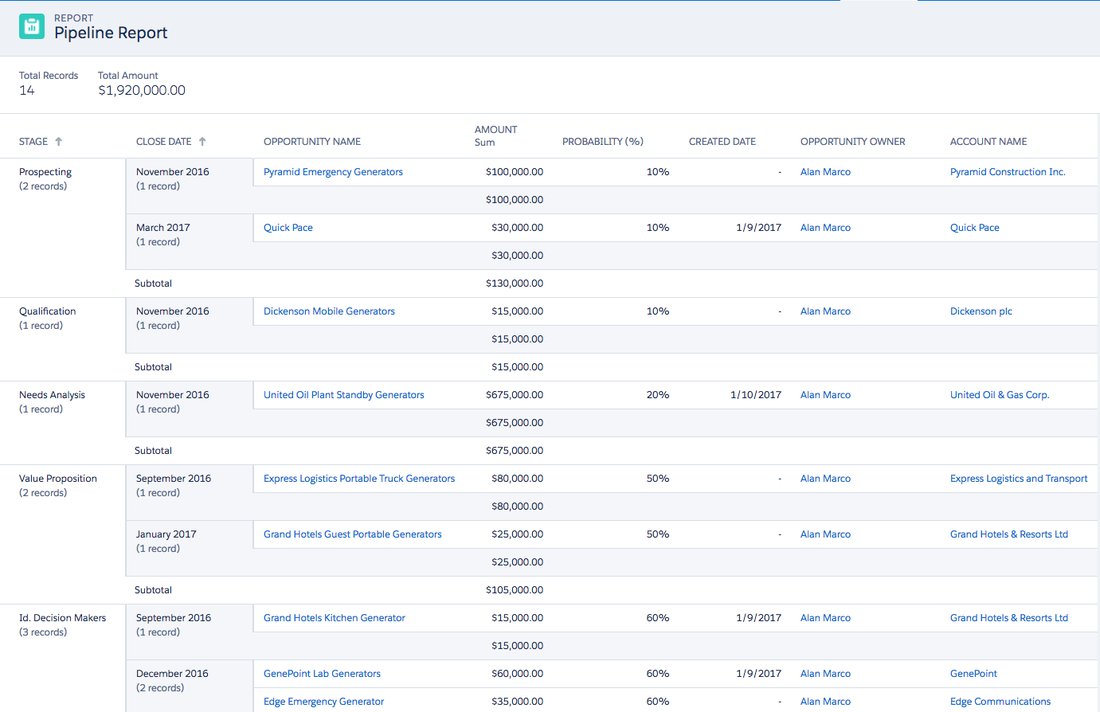
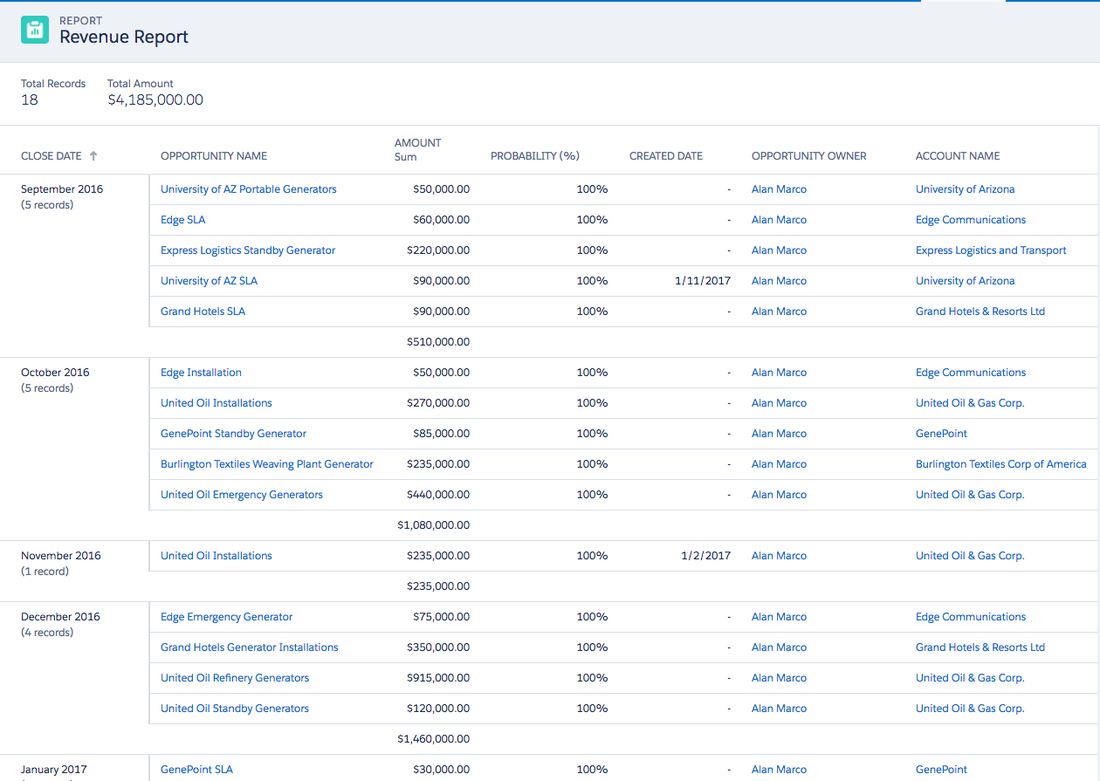
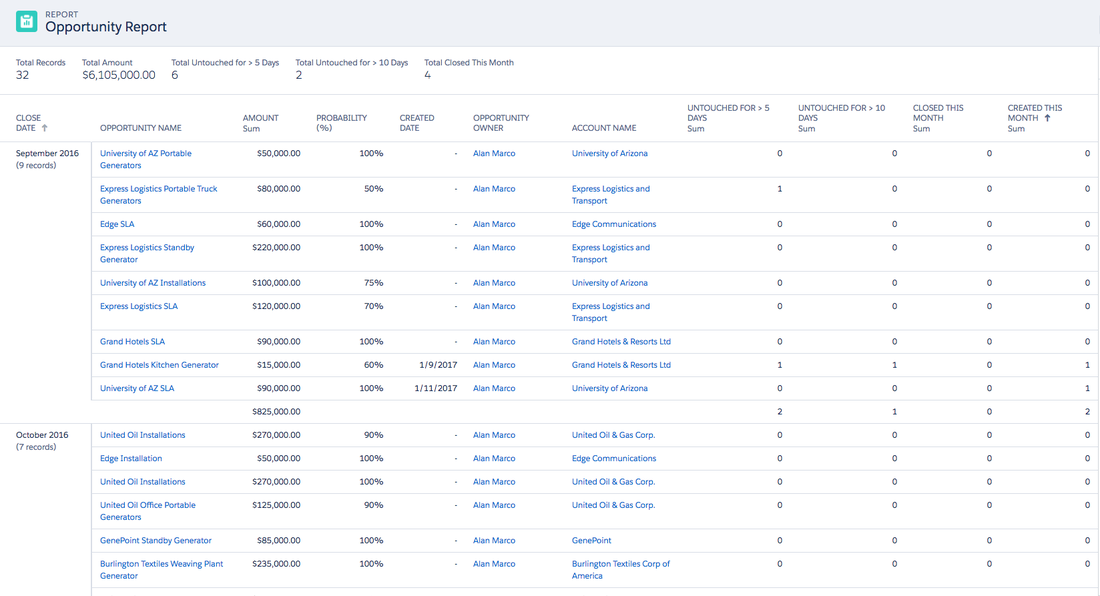
Sample Sales Cloud Dashboards & Source Reports

Frequently Asked Questions About Salesforce
Reports & Dashboards
what is a core report?
For the purposes of our reports and dashboard packages, we define a Core Report as a master report based on 1 or more related standard or custom objects, that differs significantly from other custom reports based on its report type or report format. The number of objects that can be included in a single Core Report will depend on their relationship (lookup vs. master-detail), report type (standard vs. custom), and the report format (Tabular, Summary, Matrix, or Joined)—but it generally cannot exceed 4 objects.
Every report or dashboard package includes time for us to review your data structure so we can determine what reporting roadblocks there may be, if any, due to the limitations of Salesforce standard functionality.
Every report or dashboard package includes time for us to review your data structure so we can determine what reporting roadblocks there may be, if any, due to the limitations of Salesforce standard functionality.
What is a Custom report type?
A report type defines the set of records and fields available to a report based on the relationships between a primary object and its related objects. Reports display only records that meet the criteria defined in the report type. Salesforce provides a set of pre-defined standard report types. Salesforce will also automatically add standard report types for any custom objects you create that have a lookup or master-detail relationship to other standard or custom objects.
A Custom Report Type allows you to have more flexibility than standard report types in controlling which objects and fields are available to users when building reports. Custom report Types can be based on a maximum of 4 levels of objects—as long as they are in a master-detail (parent-child) relationship—and may also include fields from any related objects.
A Custom Report Type allows you to have more flexibility than standard report types in controlling which objects and fields are available to users when building reports. Custom report Types can be based on a maximum of 4 levels of objects—as long as they are in a master-detail (parent-child) relationship—and may also include fields from any related objects.
what is a source report? how does that differ from a core report?
A Source Report is any report that a Dashboard Component pulls its data from. A single Core Report can be customized slightly to create multiple Source Reports in order to display data differently for each Dashboard Component (e.g. by modifying date ranges, field groupings, or filter criteria).
what is a dashboard component?
A Dashboard Component is an individual element that displays data graphically on a dashboard. It can be a chart (e.g. bar, line, pie, funnel), gauge, metric, or table. A single dashboard can contain a maximum of 20 components.
How are custom fields and list views used for reports and dashboards?
Our reports and dashboards methodology strategically utilizes rollups and hidden custom fields to unlock your data structure, allowing us to summarize and group data in reports beyond the normal limitations of Salesforce standard functionality.
If you are still using Salesforce Classic, we can also integrate custom list views with your Dashboards Components, allowing users to quickly access and manage their records without having to dive into any Source Reports. This allows your dashboards to double as a central location for managing your daily workflow, increasing productivity to help reach your goals even faster.
If you are still using Salesforce Classic, we can also integrate custom list views with your Dashboards Components, allowing users to quickly access and manage their records without having to dive into any Source Reports. This allows your dashboards to double as a central location for managing your daily workflow, increasing productivity to help reach your goals even faster.
how do reports and dashboards differ when viewed in salesforce classic vs. lightning experience?
When it comes to Reports and Dashboards, there are some important differences to note when switching between Salesforce Classic and the new Lightning Experience. While Lightning Experience has a more modern, sleek user interface and allows for some added flexibility in adjusting the size and position of individual Dashboard Components, it still lacks some key features that are currently only available in Salesforce Classic.
Dynamic Dashboards, which allows you to create a single dashboard that displays different data depending on the logged-in running user, is only available in Salesforce Classic. Scheduled Dashboard Refreshes are also only available in Salesforce Classic, which means users still need to manually refresh dashboards in Lightning Experience in order to update the displayed data.
We will advise you of any features that may not be available or display differently in each version and can adjust your dashboards for either user interface, depending on your company or individual preferences.
Pricing & Hours
Our Reports and Dashboards Implementation packages are billed as fixed-cost projects and are typically completed within 1-2 weeks. Any additional customizations or training required beyond what is included in each package will be billed at our standard rate of $150 per hour. Our competitive rates provide access to a team of Certified Salesforce Consultants specializing in different areas. All Salesforce Consulting Services clients receive a Free Initial 30-Minute Consultation to evaluate the scope of work and help you select the right services, after which we will provide a formal proposal with estimates before we move forward.
